Science is less deterministic than you think
This is a comment on the paper Same data, different analysts
Unless you have been living under a rock, you know that we are in the midst of what historians may one day call “The Replication Crisis Era”.
Long story short, starting in the 2000s, some scientists started sounding the alarm that many (if not a majority) of the published scientific papers could be inaccurate, misleading, or simply wrong. People started reporting examples of a practice called “p-hacking”, in which the data is “adjusted” until significant p-values start popping out. I am not talking about specific instances of a lone scientist that had committed fraud or simply lied about his results but about a systemic problem that seemed to pervade modern science. In 2015, a landmark paper published in Science (Estimating the reproducibility of Psychological Science) revealed that, after reanalyzing a set of 100 psychology papers from 3 journals with high impact factors, fewer than 50% of the papers could be reproduced. Around this time, multiple groups studied this phenomenon and most of the blame was put on the fact that many studies had low sample sizes, making them prone to noise.
But years passed and while it is clear that part of the problem has to do with small sample sizes, thinking that the issue is only about data collection paints a very incomplete picture. The variability is not related to the data alone, but also to how we handle the data. Gould et al. have published an excellent paper illustrating this. The setting is:
There are two datasets and one scientific question for each of them:
-
- The first is the “blue tit” dataset, which comes from a three-year study of wild birds nesting at Wytham Wood in the UK. It includes information about 3,720 chicks across 452 broods, with information like the weight and tarsus length of nestlings 14 days after hatching, the number of siblings they had, and the size of their parents. The question analysts had to answer was: To what extent is nestling growth influenced by competition with siblings?
-
- The second is the “Eucalyptus” dataset, derived from the Bush Returns program in Victoria, Australia. It consists of 351 quadrants surveyed across 18 different sites. Researchers were interested in reforestation on private land, and the specific question for analysts was: How does grass cover influence Eucalyptus spp. seedling recruitment?
It is important to note that both datasets involved experimental interventions, not just passive observation. In the bird study, researchers performed “cross-fostering” (moving chicks between nests to artificially enlarge or reduce brood sizes). This allowed them to isolate the effect of sibling competition from genetic factors. In the Eucalyptus study, the intervention was the removal of livestock grazing to see if the canopy would regenerate naturally. I highlight this because some people could argue that the problem is not so much about reproducibility but about observational vs interventional studies in general.
Now, the impressive part is this: The researchers recruited a massive group of 246 analysts across 173 teams to investigate these questions. Not only that, but they also found a very large group of reviewers that evaluated the reliability of the statistical methods (without seeing the results) of each analysis. To make the results comparable, each team of analysts was required to report a standardized effect size that would summarize how strong the effect was (and the direction).
The results?
Judge for yourself:
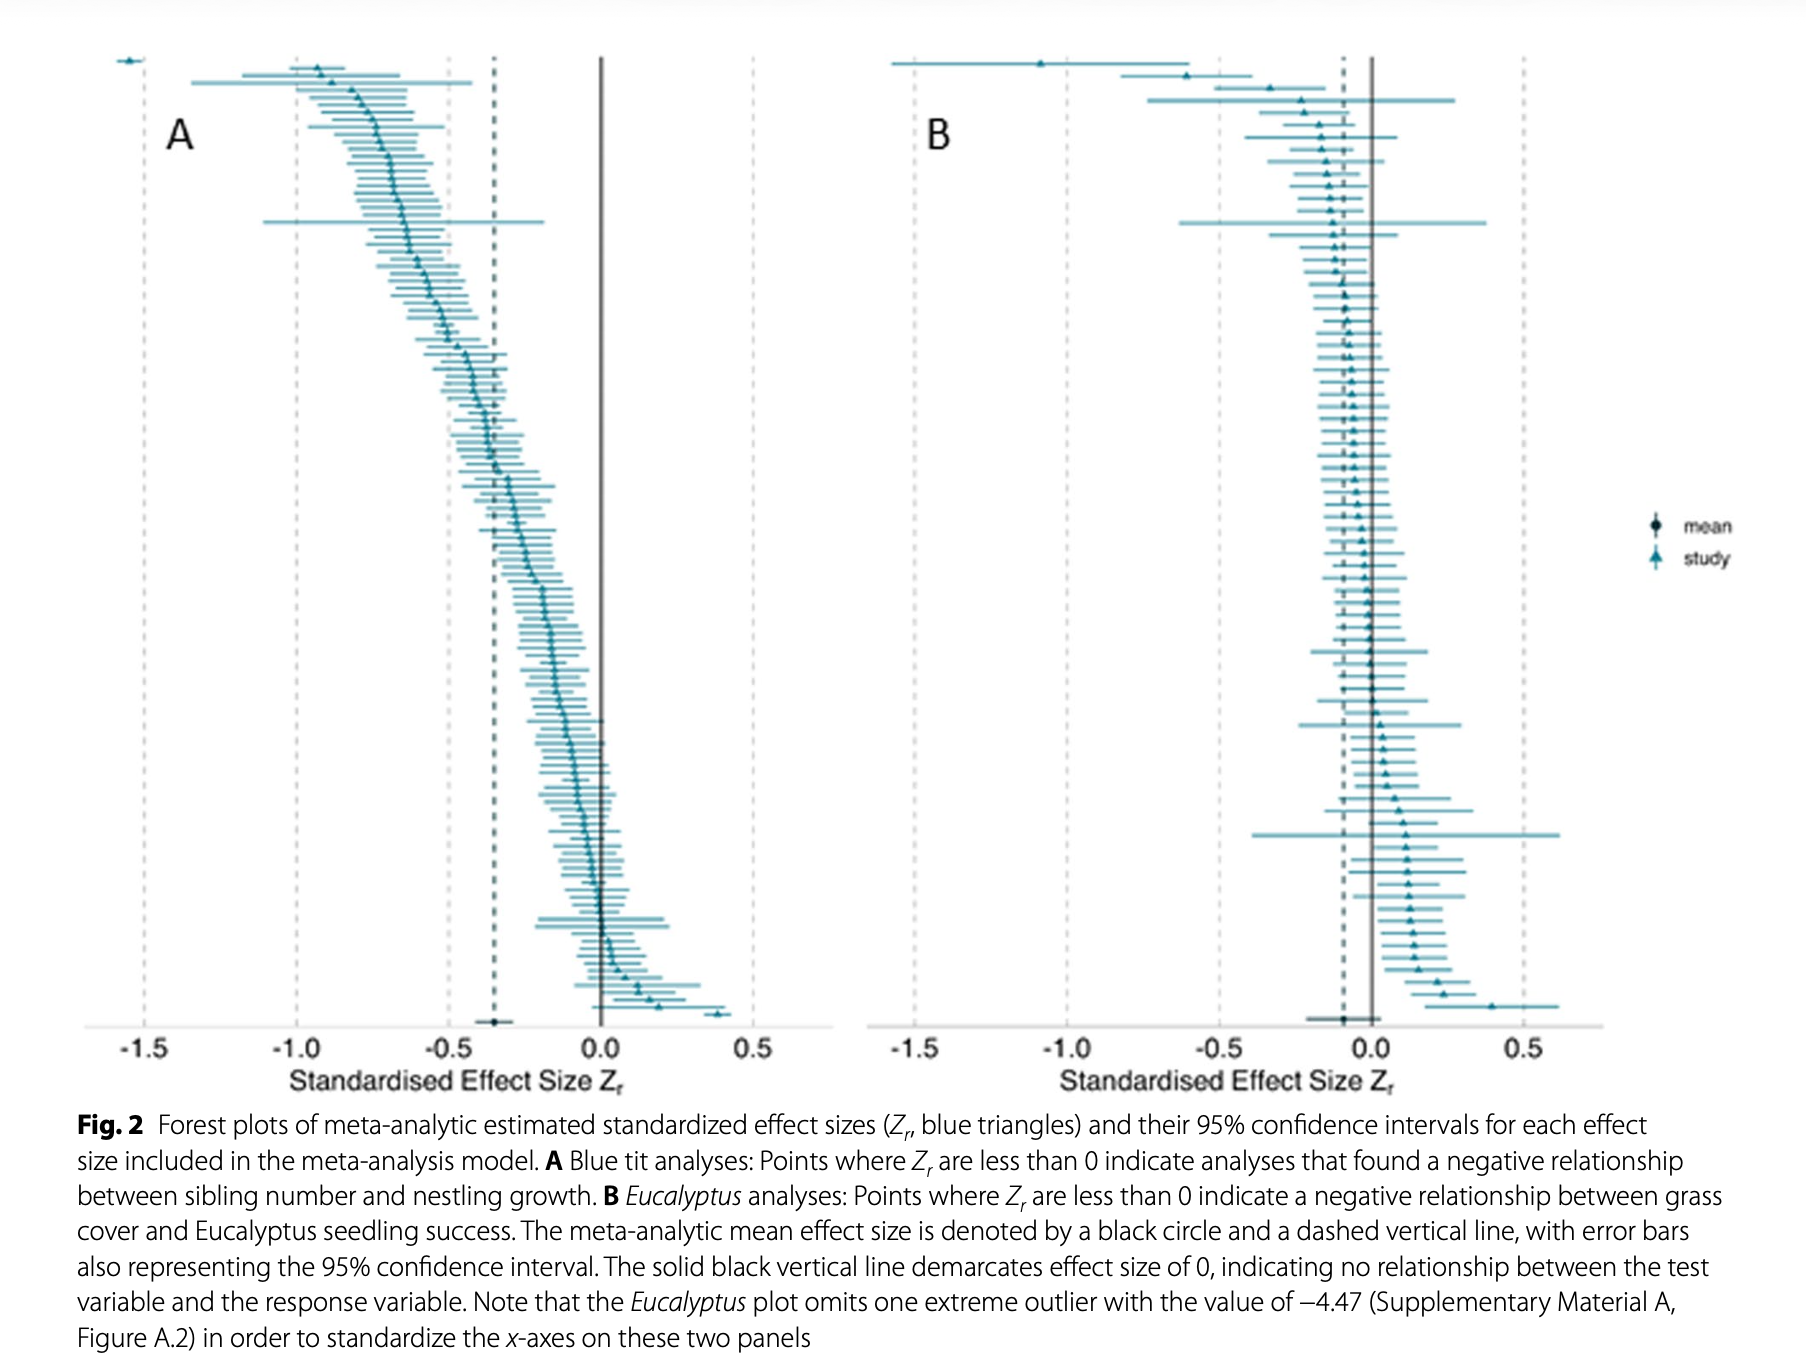 Figure 2 from the paper, which captures the main results
To simplify, what we are seeing is:
- Every horizontal line represents a different analysis from a different analyst group.
- The x-axis is the “strength” of the correlation between (A) growth and competition from siblings, (B) number of seedlings and percentage of grass.
In other words, values to the left suggest a negative relation, while values to the right suggest a positive relation. For A, most studies find a negative relation, though the magnitude changes substantially for many of them. For B, the results are more balanced; some find a very negative relation while others find a clear positive signal.
So, how does this bode for the replicability of science? Remember, we are dealing with an almost perfect scenario where everyone has access to the same dataset! Some friends of mine saw this and thought the glass was half full: at least in the bird dataset, most teams seem to recover a negative relation, though for the Eucalyptus dataset it is less clear. For me, the glass is half empty. It is true that in the bird dataset there was a clear majority in one direction, but the magnitude of the effect seems to vary almost continuously across a wide range of values. And in the Eucalyptus case, the values seem to be all over the place!
There also seemed to be very little consensus among reviewers about what constituted a good scientific approach! Some reviewers would classify one paper as “Publishable as it is” while others would call it “Unpublishable”. When removing those papers that had received marks of “Unpublishable” and “Major Revisions”, the remaining analyses still seemed not to agree on their conclusions. Similar results were also obtained when the analyses coming from people who had no self-identified expertise in statistics were removed.
So the obvious question one might ask is, where does the variability come from? Well, it seems to stem from the fact that seemingly clear scientific questions are instead pretty vague and can be translated into numbers in many different ways. Maybe an example clarifies this: let’s say that we want to measure growth (in the example of the birds). What do we use as a proxy? The weight? Or the size of the legs? Or should we combine both into a single variable? Should both have the same importance? Or should the importance be weighted? Another factor to consider is: what do we do with outliers? Traditional teaching says that in some cases they should be removed. But another solution is using statistical methods (such as non-parametric testing) that are more robust to outliers. Or should we include them (or some of them?) because they are in fact the observations containing the most information? Any of these solutions is perfectly defensible in isolation, but a proper statistical analysis can contain many of these questions that can be answered in different ways, leading in the end to quite different results.
Now, what should we conclude from this? I am not sure there is a single lesson from this paper, but it does provide some bits to update our posterior towards a region of more skepticism in general about scientific papers. I already try to be very selective with what I read because most papers are just a waste of time. To me it goes without saying, but I do not think we need to throw our hands up in despair and become postmodernists. Science has a very good track record of discovering truths and producing an accurate map of the world that surrounds us. But believing blindly in the powers of peer review and statistical analyses, as many science fanboys do, is equally mistaken. I was aware of this; this is an extra point in that direction.
The questions that scientists analyzed in this study were totally neutral (or as close as they can be). Most people will not care about whether grass is more or less important for the growth of Eucalyptus. Now, if this is the level of disagreement we find on a neutral topic with a perfect dataset, should we be surprised when, on controversial topics such as the impact of the minimum wage on the labor market, people obtain contradictory results? I was swayed by reading Bernoulli’s fallacy to believe that a large part of the problem is our very flawed box of statistical tools. Although I still believe that a more widespread use of Bayesian analysis would remove some of the constant pernicious problems that keep bugging us, now I see that the problem is also in the intrinsic “vagueness” of the world around us and this is not going away anytime soon.